
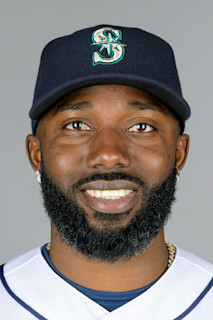
RANDY AROZARENA
01/Hitting
Regular season
| Season | Club | G | AB | R | H | 2B | 3B | HR | RBI | BB | SO | SB | AVG | OBP | SLG | OPS |
|---|---|---|---|---|---|---|---|---|---|---|---|---|---|---|---|---|
| 2026 | SEA | 136 | 505 | 92 | 138 | 28 | 1 | 22 | 66 | 59 | 128 | 21 | .273 | .349 | .463 | .813 |
| 2025 | SEA | 160 | 613 | 95 | 146 | 32 | 1 | 27 | 76 | 64 | 191 | 31 | .238 | .310 | .426 | .736 |
| 2024 | SEA | 154 | 549 | 77 | 120 | 33 | 0 | 20 | 60 | 73 | 169 | 20 | .219 | .310 | .388 | .698 |
| 2023 | TB | 151 | 551 | 95 | 140 | 19 | 3 | 23 | 83 | 80 | 156 | 22 | .254 | .349 | .425 | .773 |
| 2022 | TB | 153 | 586 | 72 | 154 | 41 | 3 | 20 | 89 | 46 | 156 | 32 | .263 | .316 | .445 | .762 |
| 2021 | TB | 141 | 529 | 94 | 145 | 32 | 3 | 20 | 69 | 56 | 170 | 20 | .274 | .344 | .459 | .803 |
| 2020 | TB | 23 | 64 | 15 | 18 | 2 | 0 | 7 | 11 | 6 | 22 | 4 | .281 | .343 | .641 | .983 |
| 2019 | STL | 19 | 20 | 4 | 6 | 1 | 0 | 1 | 2 | 2 | 4 | 2 | .300 | .364 | .500 | .864 |
| Career | – | 937 | 3,417 | 544 | 867 | 188 | 11 | 140 | 456 | 386 | 996 | 152 | .254 | .329 | .438 | .768 |
04/Where the ball went
Play log from 2015
05/Game log
Postseason
No postseason games for Randy Arozarena in 2020.
Regular season and postseason are separate tables and are never summed into one career line; spring training is excluded entirely. Hitting and pitching come from different source rows, so a two-way player has both tables and neither borrows from the other. Innings pitched is summed as outs and converted once: the stored value counts thirds, so “6.1” means six innings and one out, and adding those as decimals understates a career. ERA and WHIP are computed from those totals rather than averaged across seasons. On-base percentage is (H + BB) over (AB + BB), which runs slightly under the official figure because the source rows carry no hit-by-pitch or sacrifice fly. The charts cover 2015 onward only, and the spray chart plots batted balls with a recorded landing spot: a strikeout or a walk has no location and is not a missing dot. Its field is a representative park, not the one the ball was hit in, because a spray chart pooled across a season is hit in thirty different outfields.