
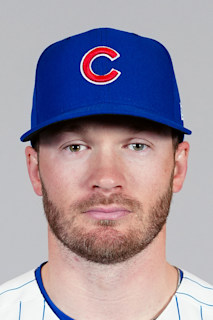
IAN HAPP
01/Hitting
Regular season
| Season | Club | G | AB | R | H | 2B | 3B | HR | RBI | BB | SO | SB | AVG | OBP | SLG | OPS |
|---|---|---|---|---|---|---|---|---|---|---|---|---|---|---|---|---|
| 2026 | CHC | 138 | 497 | 81 | 110 | 24 | 2 | 23 | 64 | 71 | 176 | 4 | .221 | .319 | .416 | .735 |
| 2025 | CHC | 150 | 569 | 87 | 138 | 32 | 0 | 23 | 79 | 87 | 151 | 6 | .243 | .343 | .420 | .763 |
| 2024 | CHC | 153 | 569 | 89 | 138 | 34 | 2 | 25 | 86 | 80 | 168 | 13 | .243 | .336 | .441 | .777 |
| 2023 | CHC | 158 | 580 | 86 | 144 | 35 | 4 | 21 | 84 | 99 | 153 | 14 | .248 | .358 | .431 | .789 |
| 2022 | CHC | 158 | 573 | 72 | 155 | 42 | 2 | 17 | 72 | 58 | 149 | 9 | .271 | .338 | .440 | .777 |
| 2021 | CHC | 148 | 465 | 63 | 105 | 20 | 1 | 25 | 66 | 62 | 156 | 9 | .226 | .317 | .434 | .751 |
| 2020 | CHC | 57 | 198 | 27 | 51 | 11 | 1 | 12 | 28 | 30 | 63 | 1 | .258 | .355 | .505 | .860 |
| 2019 | CHC | 58 | 140 | 25 | 37 | 7 | 1 | 11 | 30 | 15 | 39 | 2 | .264 | .335 | .564 | .900 |
| 2018 | CHC | 143 | 391 | 56 | 91 | 20 | 2 | 15 | 44 | 70 | 167 | 8 | .233 | .349 | .409 | .758 |
| 2017 | CHC | 115 | 364 | 62 | 92 | 17 | 3 | 24 | 68 | 39 | 129 | 8 | .253 | .325 | .514 | .839 |
| Career | – | 1,278 | 4,346 | 648 | 1,061 | 242 | 18 | 196 | 621 | 611 | 1,351 | 74 | .244 | .337 | .443 | .781 |
02/Pitching
Regular season
04/Every pitch
Play log from 2015
No pitches with a location in this window.
No pitch types recorded in this window.
05/Game log
Postseason
No postseason games for Ian Happ in 2017.
Regular season and postseason are separate tables and are never summed into one career line; spring training is excluded entirely. Hitting and pitching come from different source rows, so a two-way player has both tables and neither borrows from the other. Innings pitched is summed as outs and converted once: the stored value counts thirds, so “6.1” means six innings and one out, and adding those as decimals understates a career. ERA and WHIP are computed from those totals rather than averaged across seasons. On-base percentage is (H + BB) over (AB + BB), which runs slightly under the official figure because the source rows carry no hit-by-pitch or sacrifice fly. The charts cover 2015 onward only, and the spray chart plots batted balls with a recorded landing spot: a strikeout or a walk has no location and is not a missing dot. Its field is a representative park, not the one the ball was hit in, because a spray chart pooled across a season is hit in thirty different outfields.