
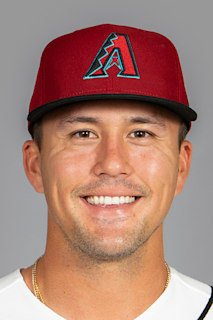
LARS NOOTBAAR
01/Hitting
Regular season
| Season | Club | G | AB | R | H | 2B | 3B | HR | RBI | BB | SO | SB | AVG | OBP | SLG | OPS |
|---|---|---|---|---|---|---|---|---|---|---|---|---|---|---|---|---|
| 2026 | AZ | 72 | 231 | 29 | 54 | 13 | 1 | 6 | 28 | 37 | 52 | 2 | .234 | .340 | .377 | .716 |
| 2025 | STL | 135 | 509 | 68 | 119 | 24 | 1 | 13 | 48 | 64 | 119 | 4 | .234 | .319 | .361 | .681 |
| 2024 | STL | 109 | 348 | 39 | 85 | 18 | 3 | 12 | 45 | 52 | 79 | 7 | .244 | .343 | .417 | .759 |
| 2023 | STL | 117 | 426 | 74 | 111 | 23 | 1 | 14 | 46 | 72 | 99 | 11 | .261 | .367 | .418 | .785 |
| 2022 | STL | 108 | 290 | 53 | 66 | 16 | 3 | 14 | 40 | 51 | 71 | 4 | .228 | .343 | .448 | .791 |
| 2021 | STL | 58 | 109 | 15 | 26 | 3 | 1 | 5 | 15 | 13 | 28 | 2 | .239 | .320 | .422 | .742 |
| Career | – | 599 | 1,913 | 278 | 461 | 97 | 10 | 64 | 222 | 289 | 448 | 30 | .241 | .341 | .403 | .743 |
04/Where the ball went
Play log from 2015
No batted balls with a location in this window.
05/Game log
Postseason
No postseason games for Lars Nootbaar in 2025.
Regular season and postseason are separate tables and are never summed into one career line; spring training is excluded entirely. Hitting and pitching come from different source rows, so a two-way player has both tables and neither borrows from the other. Innings pitched is summed as outs and converted once: the stored value counts thirds, so “6.1” means six innings and one out, and adding those as decimals understates a career. ERA and WHIP are computed from those totals rather than averaged across seasons. On-base percentage is (H + BB) over (AB + BB), which runs slightly under the official figure because the source rows carry no hit-by-pitch or sacrifice fly. The charts cover 2015 onward only, and the spray chart plots batted balls with a recorded landing spot: a strikeout or a walk has no location and is not a missing dot. Its field is a representative park, not the one the ball was hit in, because a spray chart pooled across a season is hit in thirty different outfields.