
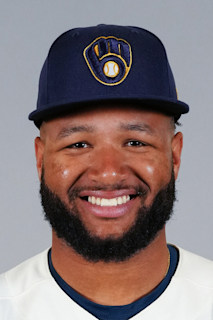
MLB/Players/Jackson Chourio
Jackson Chourio

JACKSON CHOURIO

CF · Milwaukee Brewers · 20242026 · 386 games
386
CAREER GAMES · REGULAR SEASON
3 seasons
.275
CAREER BATTING AVERAGE
419 hits in 1,521 at-bats
63
CAREER HOME RUNS
215 RBI · 58 stolen bases

01/Hitting

Season by season
Regular season
SeasonClubGABRH2B3BHRRBIBBSOSBAVGOBPSLGOPS
2026MIL1074447612624021583811615.284.340.480.820
2025MIL1315498814835421783012121.270.307.463.770
2024MIL1485288014529421793912122.275.325.464.789
Career3861,5212444198886321510735858.275.323.468.791

04/Where the ball went

2025 Postseason
Play log from 2015
Spray chart · 25 batted balls
Flyout · 97.8 mph · 320 ftLineout · 95.4 mph · 97 ftLineout · 106.1 mph · 287 ftGroundout · 106.8 mph · 59 ftLineout · 111.0 mph · 319 ftGroundout · 97.1 mph · 8 ftGroundout · 84.0 mph · 7 ftSacrifice fly · 98.1 mph · 356 ftGrounded into a double play · 102.3 mph · 71 ftFlyout · 96.9 mph · 220 ftFlyout · 86.2 mph · 325 ftGroundout · 73.1 mph · 37 ftGroundout · 82.1 mph · 7 ftPop Out · 69.5 mph · 137 ftFlyout · 98.9 mph · 333 ftDouble · 87.6 mph · 322 ftSingle · 108.0 mph · 190 ftHome Run · 106.4 mph · 389 ftDouble · 95.5 mph · 19 ftSingle · 97.9 mph · 147 ftSingle · 98.1 mph · 25 ftHome Run · 103.9 mph · 419 ftSingle · 98.7 mph · 58 ftDouble · 94.2 mph · 306 ftSingle · 111.5 mph · 20 ft
Hit (10) Out (15) Home run (2)
Average exit velocity 96.3 mph · longest 419 ft

05/Game log

2025
Postseason

No postseason games for Jackson Chourio in 2025.

Regular season and postseason are separate tables and are never summed into one career line; spring training is excluded entirely. Hitting and pitching come from different source rows, so a two-way player has both tables and neither borrows from the other. Innings pitched is summed as outs and converted once: the stored value counts thirds, so “6.1” means six innings and one out, and adding those as decimals understates a career. ERA and WHIP are computed from those totals rather than averaged across seasons. On-base percentage is (H + BB) over (AB + BB), which runs slightly under the official figure because the source rows carry no hit-by-pitch or sacrifice fly. The charts cover 2015 onward only, and the spray chart plots batted balls with a recorded landing spot: a strikeout or a walk has no location and is not a missing dot. Its field is a representative park, not the one the ball was hit in, because a spray chart pooled across a season is hit in thirty different outfields.