
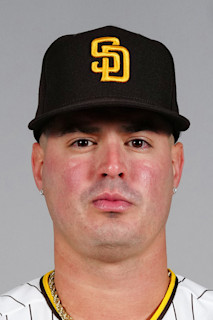
MLB/Players/Jose Miranda
Jose Miranda

JOSE MIRANDA

3B · 20222025 · 298 games
298
CAREER GAMES · REGULAR SEASON
4 seasons
.263
CAREER BATTING AVERAGE
269 hits in 1,023 at-bats
28
CAREER HOME RUNS
133 RBI · 3 stolen bases

01/Hitting

Season by season
Regular season
SeasonClubGABRH2B3BHRRBIBBSOSBAVGOBPSLGOPS
2025MIN12362600150130.167.167.250.417
2024MIN1214014411428494918662.284.315.441.756
2023MIN401421230403139240.211.258.303.561
2022MIN12544445119250156628911.268.311.426.737
Career2981,02310326957428133551943.263.301.409.709

04/Where the ball went

2025 Regular season
Play log from 2015
Spray chart · 23 batted balls
Fielder’s choice out · 71.5 mph · 54 ftLineout · 88.1 mph · 309 ftGroundout · 98.2 mph · 4 ftLineout · 89.7 mph · 171 ftGroundout · 107.0 mph · 7 ftGroundout · 97.1 mph · 21 ftLineout · 96.4 mph · 312 ftFlyout · 74.9 mph · 261 ftGroundout · 100.3 mph · 36 ftGroundout · 109.7 mph · 7 ftFlyout · 89.6 mph · 317 ftFlyout · 92.5 mph · 298 ftGroundout · 50.4 mph · 21 ftFlyout · 70.2 mph · 239 ftGroundout · 80.3 mph · 18 ftForceout · 75.2 mph · 3 ftGroundout · 91.5 mph · 14 ftSingle · 82.6 mph · 248 ftSingle · 104.5 mph · 148 ftHome Run · 98.6 mph · 389 ftSingle · 65.1 mph · 186 ftSingle · 102.9 mph · 51 ftSingle · 99.8 mph · 21 ft
Hit (6) Out (17) Home run (1)
Average exit velocity 88.5 mph · longest 389 ft

05/Game log

2025
Regular season
DateOppResultABRHHRRBIBBSO
MAR 27@ STLL 354110002
MAR 29@ STLL 153000000
MAR 30@ STLL 293010001
MAR 31@ CWSL 094000002
APR 1@ CWSW 834010201
APR 3vs HOUL 251000000
APR 5vs HOUW 614111302
APR 6vs HOUL 792000001
APR 7@ KCL 244010001
APR 8@ KCL 123000003
APR 10@ KCL 233000000
APR 12vs DETL 041010000

Regular season and postseason are separate tables and are never summed into one career line; spring training is excluded entirely. Hitting and pitching come from different source rows, so a two-way player has both tables and neither borrows from the other. Innings pitched is summed as outs and converted once: the stored value counts thirds, so “6.1” means six innings and one out, and adding those as decimals understates a career. ERA and WHIP are computed from those totals rather than averaged across seasons. On-base percentage is (H + BB) over (AB + BB), which runs slightly under the official figure because the source rows carry no hit-by-pitch or sacrifice fly. The charts cover 2015 onward only, and the spray chart plots batted balls with a recorded landing spot: a strikeout or a walk has no location and is not a missing dot. Its field is a representative park, not the one the ball was hit in, because a spray chart pooled across a season is hit in thirty different outfields.