
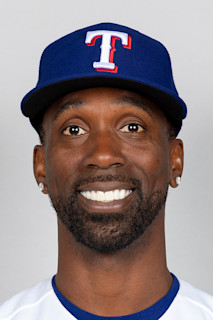
ANDREW MCCUTCHEN
01/Hitting
Regular season
| Season | Club | G | AB | R | H | 2B | 3B | HR | RBI | BB | SO | SB | AVG | OBP | SLG | OPS |
|---|---|---|---|---|---|---|---|---|---|---|---|---|---|---|---|---|
| 2026 | TEX | 37 | 73 | 8 | 14 | 2 | 0 | 1 | 5 | 9 | 22 | 0 | .192 | .280 | .260 | .541 |
| 2025 | PIT | 135 | 477 | 51 | 114 | 22 | 0 | 13 | 57 | 67 | 118 | 1 | .239 | .333 | .367 | .700 |
| 2024 | PIT | 120 | 448 | 66 | 104 | 18 | 1 | 20 | 50 | 58 | 133 | 3 | .232 | .320 | .411 | .731 |
| 2023 | PIT | 112 | 390 | 55 | 100 | 19 | 0 | 12 | 43 | 75 | 100 | 11 | .256 | .376 | .397 | .774 |
| 2022 | MIL | 134 | 515 | 66 | 122 | 25 | 0 | 17 | 69 | 57 | 124 | 8 | .237 | .313 | .384 | .697 |
| 2021 | PHI | 144 | 482 | 78 | 107 | 24 | 1 | 27 | 80 | 81 | 132 | 6 | .222 | .334 | .444 | .778 |
| 2020 | PHI | 57 | 217 | 32 | 55 | 9 | 0 | 10 | 34 | 22 | 48 | 4 | .253 | .322 | .433 | .755 |
| 2019 | PHI | 59 | 219 | 45 | 56 | 12 | 1 | 10 | 29 | 43 | 55 | 2 | .256 | .378 | .457 | .834 |
| 2018 | NYY | 155 | 569 | 83 | 145 | 30 | 3 | 20 | 65 | 95 | 145 | 14 | .255 | .361 | .424 | .785 |
| 2017 | PIT | 156 | 570 | 94 | 159 | 30 | 2 | 28 | 88 | 73 | 116 | 11 | .279 | .361 | .486 | .847 |
| 2016 | PIT | 153 | 598 | 81 | 153 | 26 | 3 | 24 | 79 | 69 | 143 | 6 | .256 | .333 | .430 | .763 |
| 2015 | PIT | 157 | 566 | 91 | 165 | 36 | 3 | 23 | 96 | 98 | 133 | 11 | .292 | .396 | .488 | .884 |
| 2014 | PIT | 146 | 548 | 89 | 172 | 38 | 6 | 25 | 83 | 84 | 115 | 18 | .314 | .405 | .542 | .947 |
| 2013 | PIT | 157 | 583 | 97 | 185 | 38 | 5 | 21 | 84 | 78 | 101 | 27 | .317 | .398 | .508 | .906 |
| 2012 | PIT | 157 | 593 | 107 | 194 | 29 | 6 | 31 | 96 | 70 | 132 | 20 | .327 | .398 | .553 | .951 |
| 2011 | PIT | 158 | 572 | 87 | 148 | 34 | 5 | 23 | 89 | 89 | 126 | 23 | .259 | .359 | .456 | .815 |
| 2010 | PIT | 154 | 570 | 94 | 163 | 35 | 5 | 16 | 56 | 70 | 89 | 33 | .286 | .364 | .449 | .813 |
| 2009 | PIT | 108 | 433 | 74 | 124 | 26 | 9 | 12 | 54 | 54 | 83 | 22 | .286 | .366 | .471 | .837 |
| Career | – | 2,299 | 8,423 | 1,298 | 2,280 | 453 | 50 | 333 | 1,157 | 1,192 | 1,915 | 220 | .271 | .361 | .455 | .816 |
04/Where the ball went
Play log from 2015
05/Game log
Postseason
No postseason games for Andrew McCutchen in 2018.
Regular season and postseason are separate tables and are never summed into one career line; spring training is excluded entirely. Hitting and pitching come from different source rows, so a two-way player has both tables and neither borrows from the other. Innings pitched is summed as outs and converted once: the stored value counts thirds, so “6.1” means six innings and one out, and adding those as decimals understates a career. ERA and WHIP are computed from those totals rather than averaged across seasons. On-base percentage is (H + BB) over (AB + BB), which runs slightly under the official figure because the source rows carry no hit-by-pitch or sacrifice fly. The charts cover 2015 onward only, and the spray chart plots batted balls with a recorded landing spot: a strikeout or a walk has no location and is not a missing dot. Its field is a representative park, not the one the ball was hit in, because a spray chart pooled across a season is hit in thirty different outfields.